Cherokee County, Iowa | |
|---|---|
.JPG) Cherokee County Courthouse, July 2014 | |
 Location within the U.S. state of Iowa | |
| Coordinates: 42°44′05″N 95°37′27″W / 42.734722222222°N 95.624166666667°W | |
| Country | |
| State | |
| Founded | 1851 |
| Named after | Cherokee people |
| Seat | Cherokee |
| Largest city | Cherokee |
| Area | |
• Total | 577 sq mi (1,490 km2) |
| • Land | 577 sq mi (1,490 km2) |
| • Water | 0.2 sq mi (0.52 km2) 0.03% |
| Population (2020) | |
• Total | 11,658 |
• Estimate (2024) | 11,658 |
| • Density | 20.2/sq mi (7.80/km2) |
| Time zone | UTC−6 (Central) |
| • Summer (DST) | UTC−5 (CDT) |
| Congressional district | 4th |
| Website | www |
| |
Cherokee County is a county located in the U.S. state of Iowa. As of the 2020 census, the population was 11,658.[2] The county seat is Cherokee.[3] The county was formed on January 15, 1851, from open territory. It was named after the Cherokee people.
Geography
According to the U.S. Census Bureau, the county has a total area of 577 square miles (1,490 km2), of which 577 square miles (1,490 km2) is land and 0.2 square miles (0.52 km2) (0.03%) is water.[4]
Major highways
Adjacent counties
- O'Brien County (north)
- Buena Vista County (east)
- Ida County (south)
- Woodbury County (southwest)
- Plymouth County (west)
Demographics
| Census | Pop. | Note | %± |
|---|---|---|---|
| 1860 | 58 | — | |
| 1870 | 1,967 | 3,291.4% | |
| 1880 | 8,240 | 318.9% | |
| 1890 | 15,659 | 90.0% | |
| 1900 | 16,570 | 5.8% | |
| 1910 | 16,741 | 1.0% | |
| 1920 | 17,760 | 6.1% | |
| 1930 | 18,737 | 5.5% | |
| 1940 | 19,258 | 2.8% | |
| 1950 | 19,052 | −1.1% | |
| 1960 | 18,598 | −2.4% | |
| 1970 | 17,269 | −7.1% | |
| 1980 | 16,238 | −6.0% | |
| 1990 | 14,098 | −13.2% | |
| 2000 | 13,035 | −7.5% | |
| 2010 | 12,072 | −7.4% | |
| 2020 | 11,658 | −3.4% | |
| 2024 (est.) | 11,658 | [5] | 0.0% |
| U.S. Decennial Census[6] 1790-1960[7] 1900-1990[8] 1990-2000[9] 2010-2018[10] | |||

2020 census

As of the 2020 census, the county had a population of 11,658 and a population density of 20.3/sq mi (7.8/km2). 96.59% of the population reported being of one race.[11]
The racial makeup of the county was 92.9% White, 0.7% Black or African American, 0.3% American Indian and Alaska Native, 0.5% Asian, 0.1% Native Hawaiian and Pacific Islander, 2.0% from some other race, and 3.4% from two or more races. Hispanic or Latino residents of any race comprised 4.5% of the population.[12]
The median age was 46.0 years, 21.7% of residents were under the age of 18, and 25.1% of residents were 65 years of age or older. For every 100 females there were 100.0 males, and for every 100 females age 18 and over there were 99.7 males age 18 and over.[11]
40.4% of residents lived in urban areas, while 59.6% lived in rural areas.[13]
There were 5,008 households in the county, of which 24.8% had children under the age of 18 living in them. Of all households, 51.1% were married-couple households, 19.4% were households with a male householder and no spouse or partner present, and 23.1% were households with a female householder and no spouse or partner present. About 32.1% of all households were made up of individuals and 16.8% had someone living alone who was 65 years of age or older. There were 5,558 housing units, of which 9.9% were vacant. Among occupied housing units, 77.0% were owner-occupied and 23.0% were renter-occupied. The homeowner vacancy rate was 2.1% and the rental vacancy rate was 8.4%.[11]
2010 census
The 2010 census recorded a population of 12,072 in the county, with a population density of 21.3/sq mi (8.2/km2). There were 5,777 housing units, of which 5,207 were occupied.[14]
2000 census
As of the census[15] of 2000, there were 13,035 people, 5,378 households, and 3,597 families residing in the county. The population density was 23 people per square mile (8.9 people/km2). There were 5,850 housing units at an average density of 10 units per square mile (3.9 units/km2). The racial makeup of the county was 98.33% White, 0.31% Black or African American, 0.16% Native American, 0.43% Asian, 0.37% from other races, and 0.40% from two or more races. 0.95% of the population were Hispanic or Latino of any race.
There were 5,378 households, out of which 29.10% had children under the age of 18 living with them, 57.30% were married couples living together, 6.50% had a female householder with no husband present, and 33.10% were non-families. 29.50% of all households were made up of individuals, and 15.30% had someone living alone who was 65 years of age or older. The average household size was 2.35 and the average family size was 2.91.
In the county, the population was spread out, with 24.60% under the age of 18, 6.80% from 18 to 24, 24.00% from 25 to 44, 24.30% from 45 to 64, and 20.40% who were 65 years of age or older. The median age was 42 years. For every 100 females there were 97.40 males. For every 100 females age 18 and over, there were 92.70 males.
The median income for a household in the county was $35,142, and the median income for a family was $42,897. Males had a median income of $29,612 versus $21,181 for females. The per capita income for the county was $17,934. About 5.50% of families and 7.30% of the population were below the poverty line, including 9.70% of those under age 18 and 5.70% of those age 65 or over.
Communities
Cities
Townships
Cherokee County is divided into sixteen townships:
Population ranking
The population ranking of the following table is based on the 2020 census of Cherokee County.[2]
† county seat
| Rank | City/Town/etc. | Municipal type | Population (2020 Census) |
|---|---|---|---|
| 1 | † Cherokee | City | 5,199 |
| 2 | Marcus | City | 1,079 |
| 3 | Aurelia | City | 968 |
| 4 | Quimby | City | 249 |
| 5 | Washta | City | 209 |
| 6 | Cleghorn | City | 240 |
| 7 | Meriden | City | 161 |
| 8 | Larrabee | City | 123 |
Politics
| Year | Republican | Democratic | Third party(ies) | |||
|---|---|---|---|---|---|---|
| No. | % | No. | % | No. | % | |
| 1896 | 2,343 | 60.08% | 1,464 | 37.54% | 93 | 2.38% |
| 1900 | 2,432 | 63.10% | 1,253 | 32.51% | 169 | 4.39% |
| 1904 | 2,446 | 74.60% | 688 | 20.98% | 145 | 4.42% |
| 1908 | 2,300 | 66.07% | 1,084 | 31.14% | 97 | 2.79% |
| 1912 | 381 | 12.32% | 930 | 30.08% | 1,781 | 57.60% |
| 1916 | 1,578 | 48.26% | 1,646 | 50.34% | 46 | 1.41% |
| 1920 | 4,544 | 77.69% | 1,211 | 20.70% | 94 | 1.61% |
| 1924 | 3,240 | 52.29% | 904 | 14.59% | 2,052 | 33.12% |
| 1928 | 3,909 | 58.91% | 2,701 | 40.71% | 25 | 0.38% |
| 1932 | 2,570 | 34.81% | 4,701 | 63.68% | 111 | 1.50% |
| 1936 | 2,902 | 36.99% | 4,716 | 60.11% | 227 | 2.89% |
| 1940 | 4,458 | 53.50% | 3,855 | 46.27% | 19 | 0.23% |
| 1944 | 3,723 | 53.58% | 3,197 | 46.01% | 29 | 0.42% |
| 1948 | 3,318 | 46.44% | 3,739 | 52.34% | 87 | 1.22% |
| 1952 | 6,018 | 70.46% | 2,502 | 29.29% | 21 | 0.25% |
| 1956 | 4,821 | 59.67% | 3,254 | 40.28% | 4 | 0.05% |
| 1960 | 4,791 | 59.10% | 3,309 | 40.82% | 6 | 0.07% |
| 1964 | 3,180 | 42.26% | 4,336 | 57.62% | 9 | 0.12% |
| 1968 | 4,436 | 59.18% | 2,705 | 36.09% | 355 | 4.74% |
| 1972 | 4,726 | 62.23% | 2,780 | 36.61% | 88 | 1.16% |
| 1976 | 3,993 | 53.40% | 3,358 | 44.91% | 127 | 1.70% |
| 1980 | 4,087 | 54.49% | 2,719 | 36.25% | 694 | 9.25% |
| 1984 | 4,046 | 54.16% | 3,349 | 44.83% | 75 | 1.00% |
| 1988 | 3,218 | 46.94% | 3,574 | 52.14% | 63 | 0.92% |
| 1992 | 2,768 | 40.16% | 2,590 | 37.57% | 1,535 | 22.27% |
| 1996 | 2,629 | 41.27% | 2,853 | 44.79% | 888 | 13.94% |
| 2000 | 3,463 | 52.53% | 2,845 | 43.16% | 284 | 4.31% |
| 2004 | 3,758 | 55.30% | 2,988 | 43.97% | 50 | 0.74% |
| 2008 | 3,372 | 52.95% | 2,890 | 45.38% | 106 | 1.66% |
| 2012 | 3,662 | 57.08% | 2,634 | 41.06% | 119 | 1.86% |
| 2016 | 4,192 | 66.99% | 1,679 | 26.83% | 387 | 6.18% |
| 2020 | 4,495 | 68.96% | 1,936 | 29.70% | 87 | 1.33% |
| 2024 | 4,398 | 72.04% | 1,611 | 26.39% | 96 | 1.57% |
Education
School districts include:[17]
- Alta-Aurelia Community School District - Formed on July 1, 2018.[18]
- Cherokee Community School District
- Galva-Holstein Community School District - Former on July 1, 1980.[18]
- Kingsley-Pierson Community School District
- Marcus-Meriden-Cleghorn Community School District - Former on July 1, 1993.[18]
- River Valley Community School District - Former on July 1, 1996.[18]
- Sioux Central Community School District - Former on July 1, 1993.[18]
- South O'Brien Community School District - Former on July 1, 1993.[18]
Former school districts:
- Alta Community School District[19] - Merged into Alta-Aurelia on July 1, 2018.[18]
- Aurelia Community School District - Merged into Alta-Aurelia on July 1, 2018.[18]
See also
References
- ↑ "Iowa County Names and Numbers". Iowa Department of Administrative Services. Retrieved December 22, 2025.
- 1 2 "2020 Census State Redistricting Data". census.gov. United states Census Bureau. Retrieved August 12, 2021.
- ↑ "Find a County". National Association of Counties. Archived from the original on May 3, 2015. Retrieved June 7, 2011.
- ↑ "US Gazetteer files: 2010, 2000, and 1990". United States Census Bureau. February 12, 2011. Retrieved April 23, 2011.
- ↑ "Population and Housing Unit Estimates Tables". United States Census Bureau. Retrieved July 24, 2025.
- ↑ "U.S. Decennial Census". United States Census Bureau. Retrieved July 14, 2014.
- ↑ "Historical Census Browser". University of Virginia Library. Archived from the original on August 11, 2012. Retrieved July 14, 2014.
- ↑ "Population of Counties by Decennial Census: 1900 to 1990". United States Census Bureau. Retrieved July 14, 2014.
- ↑ "Census 2000 PHC-T-4. Ranking Tables for Counties: 1990 and 2000" (PDF). United States Census Bureau. Archived (PDF) from the original on March 27, 2010. Retrieved July 14, 2014.
- ↑ "State & County QuickFacts". United States Census Bureau. Archived from the original on June 7, 2011. Retrieved July 14, 2014.
- 1 2 3 "2020 Decennial Census Demographic Profile (DP1)". United States Census Bureau. 2021. Retrieved December 25, 2025.
- ↑ "2020 Decennial Census Redistricting Data (Public Law 94-171)". United States Census Bureau. 2021. Retrieved December 25, 2025.
- ↑ "2020 Decennial Census Demographic and Housing Characteristics (DHC)". United States Census Bureau. 2023. Retrieved December 25, 2025.
- ↑ "Population and Housing Occupancy Status: 2010 – State – County". United States Census Bureau American FactFinder. Archived from the original on September 29, 2015. Retrieved March 9, 2011.
- ↑ "U.S. Census website". United States Census Bureau. Retrieved January 31, 2008.
- ↑ Leip, David. "Dave Leip's Atlas of U.S. Presidential Elections". uselectionatlas.org. Retrieved April 25, 2018.
- ↑ Geography Division (December 18, 2020). 2020 CENSUS - SCHOOL DISTRICT REFERENCE MAP: Cherokee County, IA (PDF) (Map). United States Census Bureau. Retrieved September 30, 2025. - Text list
- 1 2 3 4 5 6 7 8 "Reorganization and Dissolution Action Since 1965-66". Iowa Department of Education. Retrieved September 30, 2025.
- ↑ Geography Division (November 28, 2010). SCHOOL DISTRICT REFERENCE MAP (2010 CENSUS): Cherokee County, IA (PDF) (Map). United States Census Bureau. Retrieved September 30, 2025. - Text list
Places adjacent to Cherokee County, Iowa | ||||||||||||||||
|---|---|---|---|---|---|---|---|---|---|---|---|---|---|---|---|---|
| ||||||||||||||||
Municipalities and communities of Cherokee County, Iowa, United States | ||
|---|---|---|
| Cities | 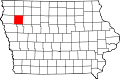 | |
| Townships | ||
| Unincorporated communities | ||
| International | |
|---|---|
| National | |
| Other | |